
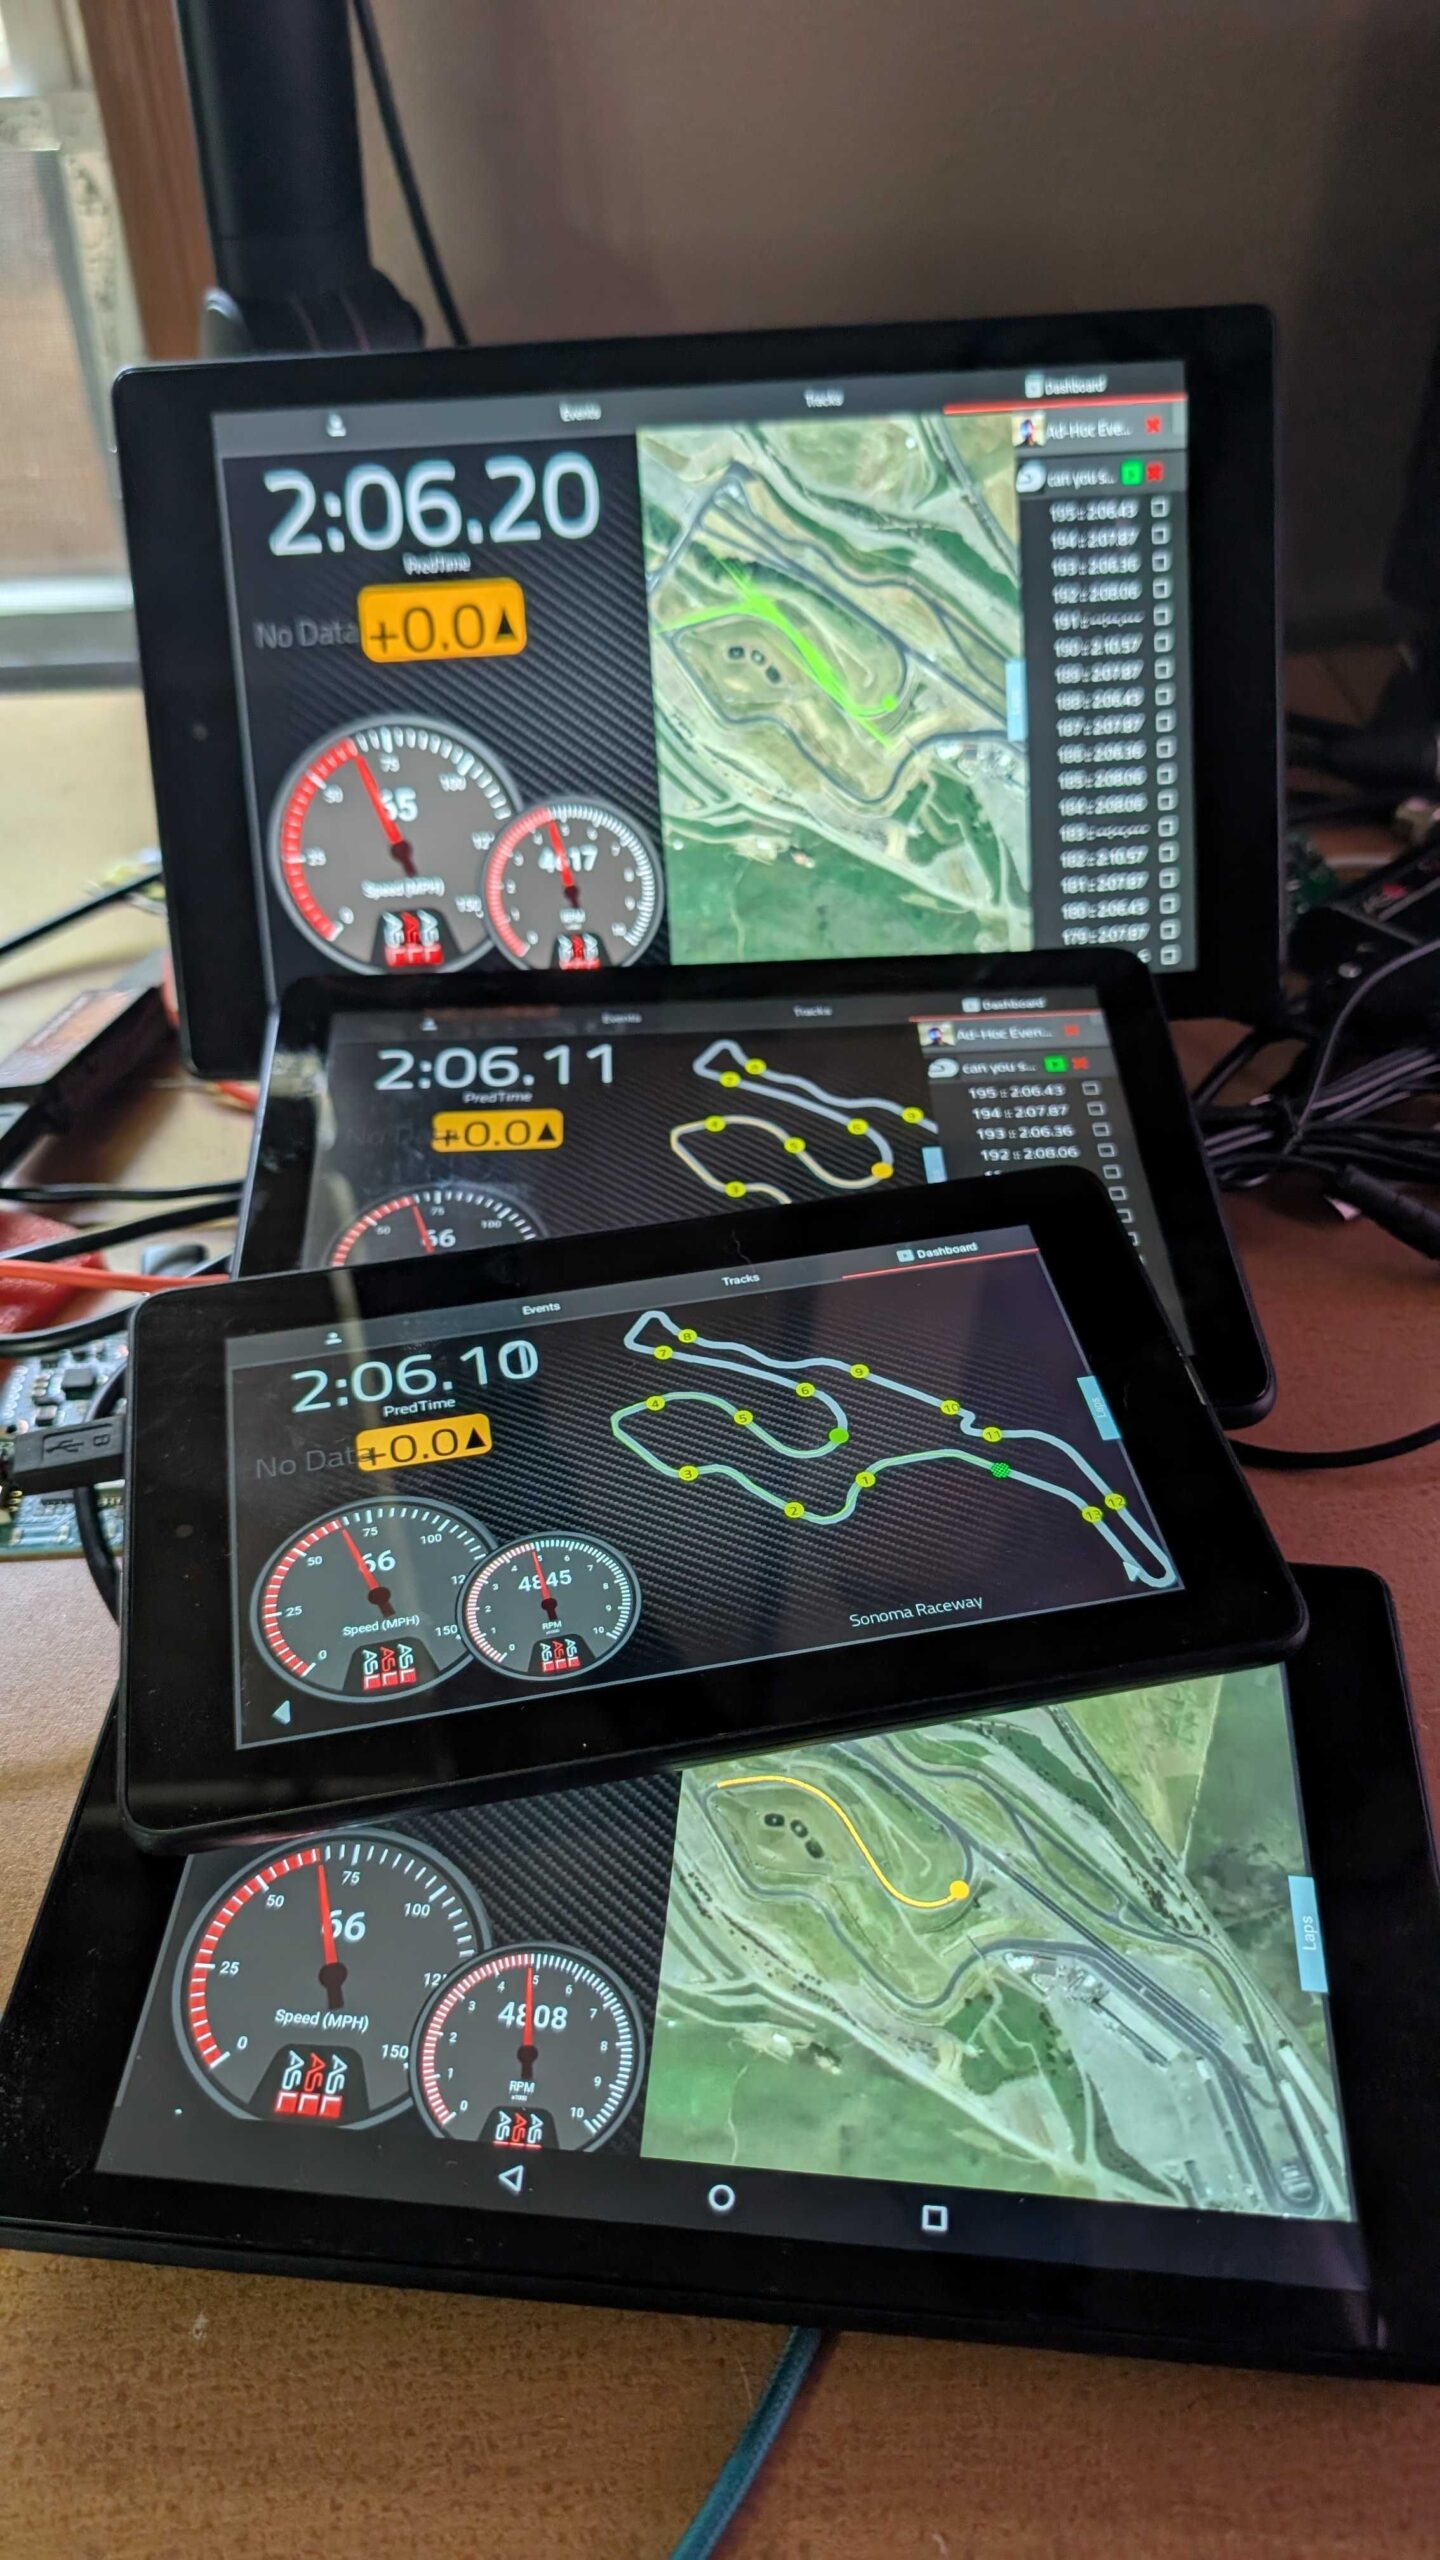
Podium app 0.8.0 is here, and it brings the single most requested capability we have shipped in a while: you can now upload log files from other data systems straight into Podium, right from the app. On top of that, satellite imagery comes to the Map View gauge, both dashboard designers were rebuilt, and this release gets your app ready for the next generation Podium platform.
Ready for the next generation Podium platform
The next generation Podium platform is coming very soon, and 0.8.0 is the release that gets your app ready for it.
This version can talk to both the current Podium platform and the new one. It connects to the Podium system you use today, and when we make the switch, the app will follow along on its own. We have worked hard to keep you from being stranded: there is no second update to install on race weekend and no window where your app suddenly cannot reach Podium.
What this means for you
Update now, ahead of the big transition, and you are set. This is the whole reason we shipped the capability early rather than at switchover time. If you only update your app once a season, make this the one.
Bring your data to Podium, whatever system recorded it
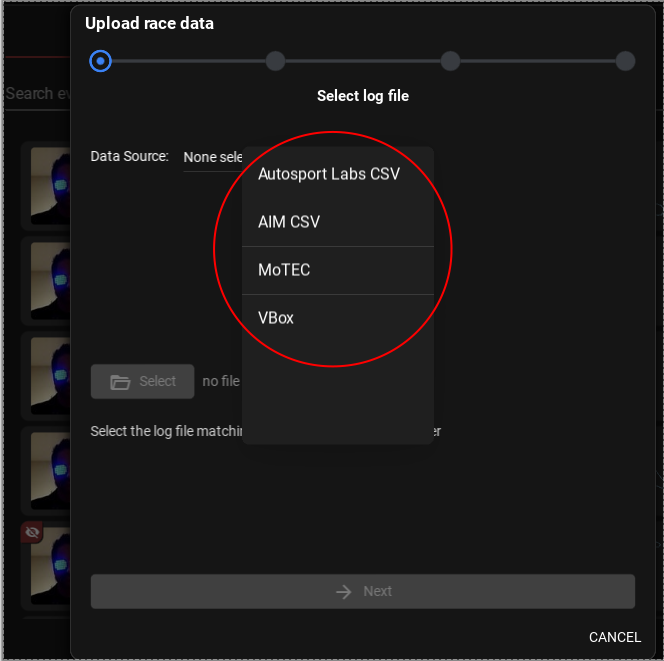
Podium has always been about your racing, not about which box is bolted to your car. With 0.8.0 you can upload log files directly from the app, including data recorded by systems that are not ours.
Supported formats
- AIM (CSV export)
- MoTeC (CSV export)
- VBOX (.vbo)
- Autosport Labs (CSV log files)
For AIM and MoTeC, export your session to CSV from your own analysis software first, then pick that file in the Podium app. VBOX .vbo files and Autosport Labs CSV logs can be uploaded as they are.
A shortcut right on the home screen
Uploading is not buried in a menu. There is a log file upload shortcut on the home screen, so you can get a session up to Podium in a few taps while you are still in the paddock.
Channel names get sorted out for you
Every data system names its channels differently. One logger calls it EngineTemp, another calls it Water Temp, a third calls it ECT. If those names went into Podium as-is, your sessions would never line up with each other and your dashboards would need rebuilding for every source.
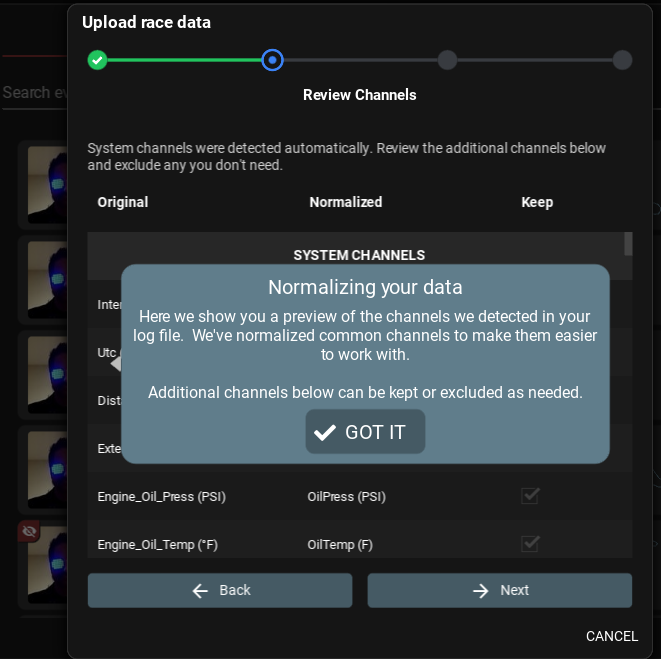
So the upload adds a step: before the file goes up, the app matches your channel names against Podium’s standard channels and shows you what it found. Channels it recognizes are mapped to the canonical name and units automatically, so a session from a MoTeC lines up with a session from a RaceCapture. Channels it does not recognize are tidied up and kept as additional channels, and you can untick any you do not want cluttering the session before it uploads.
Log file upload is available on Android, Windows, macOS, and Linux in this release. iOS support is coming.
During the import, data is normalized to a common format so you can compare apples:apples regardless of the source data system. Yes, you can easily compare AIM against VBOX, or any other supported system. Let us know what new log file formats we should support!
Satellite imagery comes to the Map View gauge
The Track Map gauge has grown up. It is now called the Map View gauge, and it can render your driving line on top of real satellite imagery in addition to the high contrast track map outline.
Seeing your line against actual pavement, curbing, and runoff changes what you can learn from a lap. A track outline tells you the shape of your line. Satellite imagery tells you where that line sits on the road: how much curb you are actually using, whether you are truly tracking out to the edge on exit, and how much of the corner you are leaving unused. That context is hard to get from an outline alone, and it is very hard to get from memory after the session.
You can switch between satellite imagery and the track map outline by pressing the map layers icon in the gauge. Once selected, the Map View gauge will remember your setting.
Two dashboard layout systems, rebuilt
Both dashboard layout designers received significant updates, which will make it easier to organize your data.
Flow view is now a nestable block layout
Flow view has been migrated to a nestable blocks layout that offers more flexibility for organizing your gauges. Instead of fighting with a fixed arrangement, you can now compose rows and columns and nest them, which makes it far easier to build a dashboard where the important channels are large and the supporting channels tuck in around them. Your existing dashboards migrate over automatically.
Snap to grid for Freeform dashboards
Freeform view gives you complete control over gauge placement, and that freedom used to include the freedom to be a few pixels off. Freeform now snaps gauges to a grid as you drag and resize them, so panels line up and size consistently, making it faster to build dashboards with precise alignments.
Refreshed gauge graphics
A few gauges got a visual pass in this release.
- Overview gauge: updated graphics for a cleaner, more modern look at a glance.
- Digital gauge: the default design is now a colored outline, which reads more clearly on screen.
- Multi lap digital gauges: when you are comparing laps, digital gauge elements now use their assigned lap colors, so the number you are reading matches the lap color you are looking at on the chart. Single gauge elements keep the familiar high contrast coloring.
Times now shown in your local time zone
Dates and times throughout the app are now converted to your device’s local time zone before they are displayed, and times you enter when editing an event are interpreted the same way.
If you have ever watched a livestream from three time zones away and had to do arithmetic to work out when a session actually started, this one is for you. It matters most for the people following along from home while the team is at the track.
Joining an event, made quicker
You can now select your device directly when joining an event, which saves a step in a workflow you probably run several times a weekend. Editing a device that is already at an event has been reworked as well, resolving a set of errors that could come up in that view.
More fixes and refinements
A long list of papercuts got fixed in this release. A few worth calling out:
- Heat Chart: better marker contrast, corrected color brightness, fixed rendering when displaying by time, and fixed rendering errors in live telemetry mode.
- Heat trace on the track map: now updates live and stays in sync with the data as distance progresses.
- Time Delta chart: resolved rendering and calculation errors.
- Track map stability: fixed a crash when removing points from a path.
- Overview gauge: now reads the correct channel for tire pressure.
Get it on all the platforms
Android: Download from Google Play beta
iOS: Download from iTunes
Windows: Download Direct
OSX: Download Direct
Linux: Download Direct
Full Change Log
==0.8.0==
* New: Upload log files to Podium (AIM, MoTeC, VBox, AutosportLabs) (not yet available on iOS)
* New: Satellite map view mode added to trackmap view; gauge renamed to Map View
* New: Add snap-to-grid for Freeform dashboard view
* New: Flowview dashboard upgraded to nestable blocks layout
* New: Improved graphics for Overview Gauge
* New: Support for nextgen Podium platform
* New: Update default design for digital gauge to a colored outline
* Fix: Ensure digital gauge multi-lap selection shows the selected lap color
* Fix: Resolve errors editing a device at an event
* Fix: Ensure times shown in the app are localized to the user's time zone
* Fix: Allow for directly selecting the device when joining an event, saving a step
* Fix: Improve Heat Chart marker contrast, time-mode rendering issues, and color brightness
* Fix: Resolve Heat Chart rendering errors when in live telemetry mode
* Fix: Resolve Rendering / calculation errors in Time Delta chart
* Fix: Resolve Track map crash when trying to remove points from path
* Fix: Ensure Overview Gauge has correct channel for tire pressure
* Fix: Heat trace on track map does not update live
* Fix: Ensure track map gauge heat map stays in sync with data